Evaluating Card Revenue Data Quality
Enigma's card revenue data shows strong accuracy, with 67% of brands having error rates within ±30% of ground truth data, and particularly high precision for businesses with annual revenues below $100k or above $1M.
This guide helps you validate Enigma's card revenue data against your own ground truth sources. Whether you're evaluating data quality for risk assessment, sales intelligence, or market analysis, you'll learn how to:
- Measure and interpret error rates
- Validate revenue bucket accuracy
- Understand common comparison challenges
- Make informed decisions about data quality
Quality Metrics
We evaluate card revenue data quality through four key metrics, each designed to answer specific business questions:
| Metric | Business Question | Success Criteria |
|---|---|---|
| Error Rate | How close are our revenue estimates to actual values? | ±30% of ground truth |
| Revenue Buckets | Can we accurately segment businesses by revenue tier? | >80% precision in key ranges |
| Growth Trends | Do we capture revenue changes reliably? | Strong correlation with ground truth |
| Data Coverage | What portion of businesses have revenue data? | >90% for card-accepting industries |
Each metric helps validate a different aspect of our data quality, ensuring you can trust Enigma's revenue data for your specific use case.
Validation Process
Step 1: Prepare Your Data
Start with a recent time period where you have reliable card spend data, ideally monthly data from 2024. Structure your input file with these key fields:
- Required: Business name, address (for location matching)
- Optional: Website, phone, legal name, person details
Step 2: Choose Your Entity Type
Select the appropriate comparison level:
- Brand Level: Use for companies where you have total company revenue (e.g., all Starbucks locations)
- Location Level: Use when you have individual store revenue data
Matching at the correct level is crucial for accurate comparison. Brand-level matching includes both in-store and online revenue, while location matching only includes in-store revenue.
Step 3: Calculate Error Rates
- Match your entities to Enigma IDs
- Compare monthly revenue values using our standard error formula:
Error = (Enigma - Truth) / ((Enigma + Truth) / 2) - Group results into 10% buckets for distribution analysis
Step 4: Analyze Results
Focus your analysis on these key areas:
- Distribution of error rates
- Precision within revenue buckets
- Industry-specific patterns
- Data coverage in your target segments
Methodologies and Example Results
Error Rate: Percentage Error (%) - Enigma Card Revenue Amount
What is the distribution of percentage error (%) between Enigma's card revenues and true card spend?
Methodology
To calculate the distribution of percentage error (%) between Enigma's card revenues and a ground truth set, we recommend:
- Picking a relevant time period, contained in both Enigma and the ground truth set
- Example:
- You have card spend data, by month during 2024
- Example:
- Ensuring your input file is structured with one row per entity, with at least a brand name (and address if choosing operating locations). You may also include attributes such as website, phone, legal name, and person to improve results
- Choosing the relevant entity type from Enigma's data model:
- Brand
- Example: You have aggregated card spend for all Starbucks stores in US
- Operating Location
- Example: You have card spend for individual Starbucks stores
- Brand
- Enriching your input file:
- Match the entities in your file to Enigma's entity type (e.g. brands)
- Append attributes including card_revenue_amount for period = 1m, with period_end_date during 2024.
- To measure the percentage error between Enigma's card_revenue_amount and true card spend data (true_card_amount) during an individual month of data:
- Percentage error = (Enigma card_revenue_amount - true_card_amount)/((Enigma card_revenue_amount + true_card_amount)/2)
- Plot the distribution of percentage error, we recommend buckets of 10% (counting how many brands/operating locations in your sample have a percentage error in this range).
Results
When we compare Enigma's latest annual card revenues ($) to the same annual period in our ground truth set, we see the below distribution of percentage error rates.
We learned that our ground truth set often contains online spend for smaller (e.g. single-location) brands, but not for larger (e.g. multi-location brands). Enigma's brands always contain both "in-store" (from operating locations), and "online" spend, while our operating locations only include "in-store" spend. To ensure a fair comparison to the ground truth set, we use Enigma's brand revenues (including online) for single location brands, and the sum of all of Enigma's operating location revenues (i.e. excluding online spend) within a brand for multi-location brands.
Examples of high accuracy/low accuracy revenues on a plot of Enigma data vs. ground truth:
- High accuracy: Percentage error of -6%
- Enigma card revenue: $4.2M
- Ground truth revenue: $4.4M
- Low accuracy: Percentage error of -80%
- Enigma card revenue: $2.5M
- Ground truth revenue: $5.9M
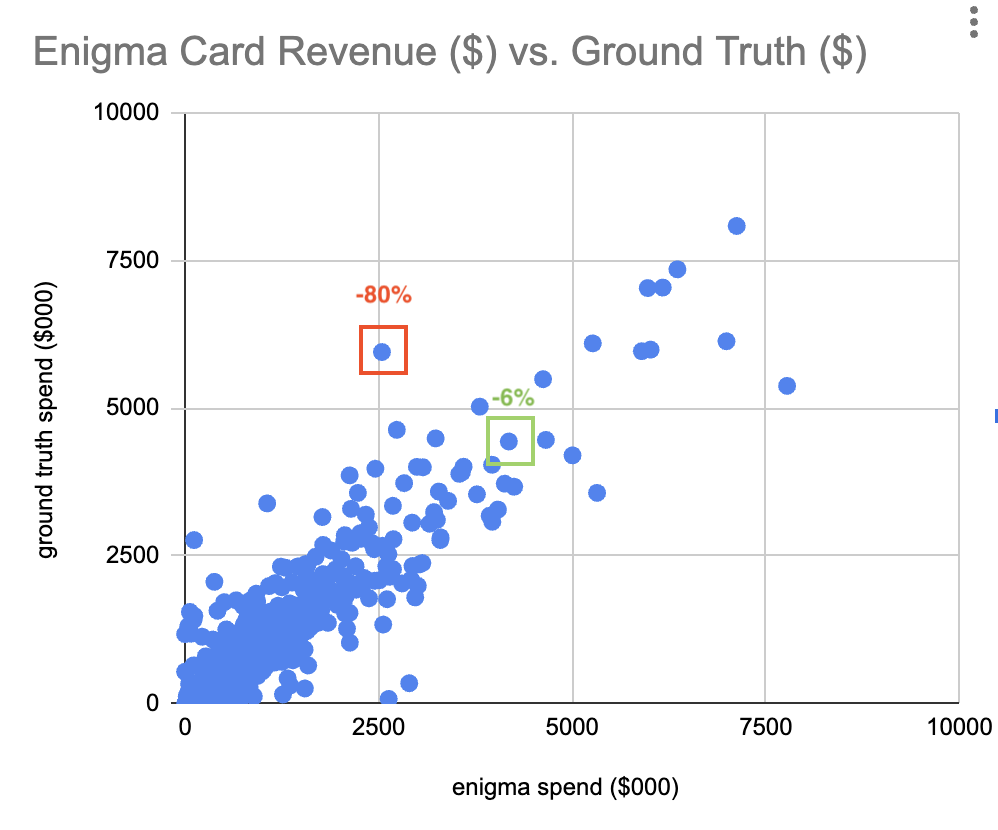
Axes are cut off at $10M in spend, for visibility. Enigma data and ground truth set both include brands with >$10M in revenue.
Precision: Accuracy of Buckets - Card Revenue Amount ($)
Are Enigma's card revenue buckets close to true card spend buckets?
Methodology
To compare Enigma's card revenue buckets to ground truth data, we recommend:
- Choosing your revenue buckets:
- E.g. $0-$50k, $50-$100k, $100-$150k, $150-$250k, $250k-$500k, $500-$1M, $1M-$5M, $5M+
- Picking a relevant time period, contained in both Enigma and the ground truth set
- Example:
- You have card spend data, by month during 2024
- Example:
- Ensuring your input file is structured with one row per entity, with at least a brand name (and address if choosing operating locations). You may also include attributes such as website, phone, legal name, and person to improve results.
- Choosing the relevant entity type from Enigma's data model:
- Brand
- Example: You have aggregated card spend for all Starbucks stores and online spend (e.g. website, app payments) in US
- Operating Location
- Example: You have in-store card spend for individual Starbucks stores
- Brand
- Enriching your input file:
- Match the entities in your file to Enigma's entity type (e.g. brands)
- Append attributes including card_revenue_amount for period = 1m, with period_end_date during 2024.
- Checking how many enigma matches have revenue during the time period requested
- Calculating precision for each revenue bucket e.g. for $1M-$5M - what % of Enigma entities with $1M-$5M in annual card revenue also have $1M-$5M of annual card revenue in your ground truth set.
Results
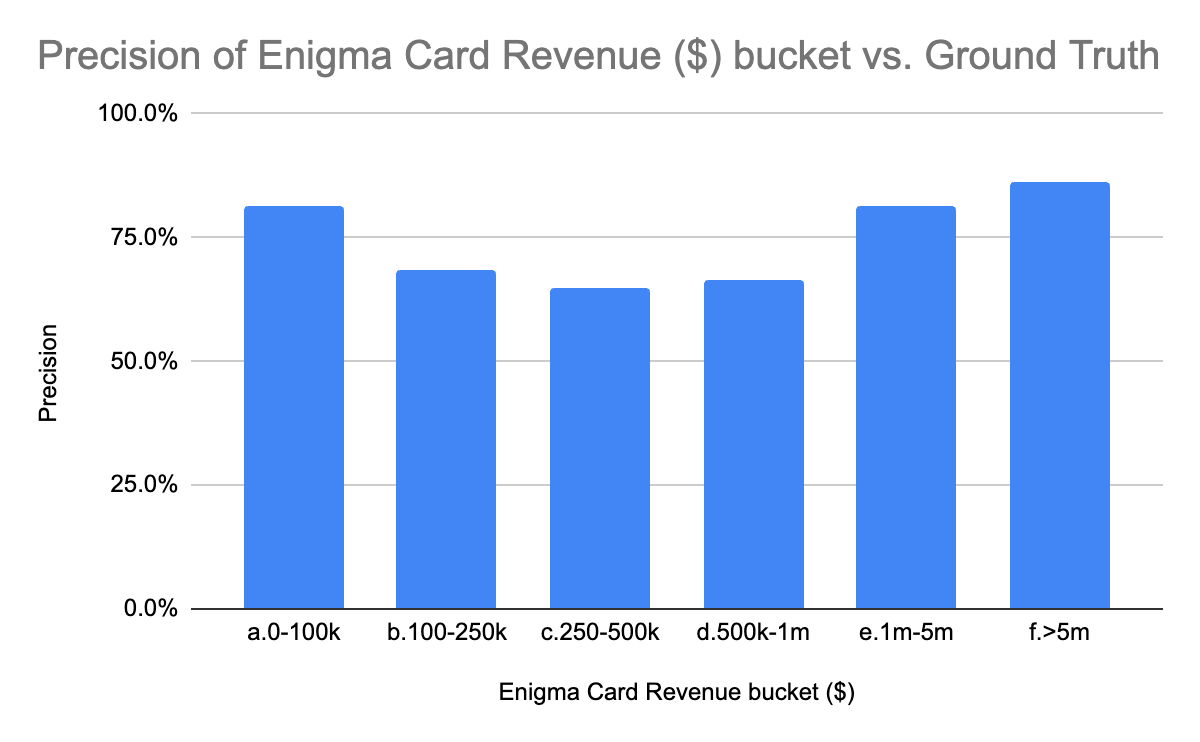
When we compare Enigma's data to third party payment processor data, per the methodology outlined above, we see the below precision estimates for brand revenues in buckets $0-$50k, $50-$100k, $100-$150k, $150-$250k, $250k-$500k, $500-$1M, $1M-$5M, $5M+
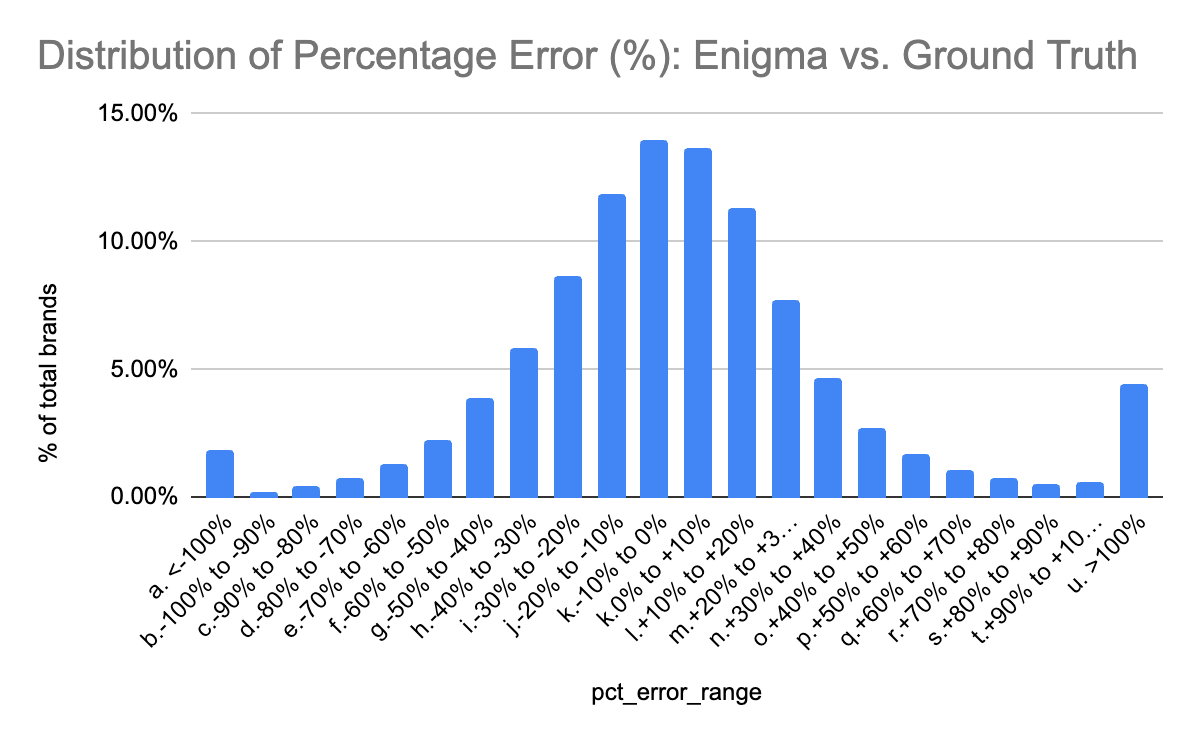
In this comparison we see that most Enigma brand revenues have a low absolute percentage error relative to ground truth data:
- 51% of brands have a percentage error between -20% and 20%
- 67% of brands have a percentage error between -30% and 30%
Here we follow the same rule for our comparison - we use Enigma brand revenues to compare to ground truth set brand revenues for single-location brands, but aggregated Enigma location revenues to compare to ground truth set brand revenues for multi-location brands.
Based on these results, we can say the following about Enigma's revenue data:
- Very accurate (precision >80%) buckets: $0-$100k, $1-$5M, >$5M
- Enigma is very often accurate for brands with less than $100k or more than $1M in revenue
- Moderately accurate (precision >60%) buckets: $100-$250k, $250-$500k, $500k-$1M
- Enigma is often accurate for brands with $100k-$1M in revenue
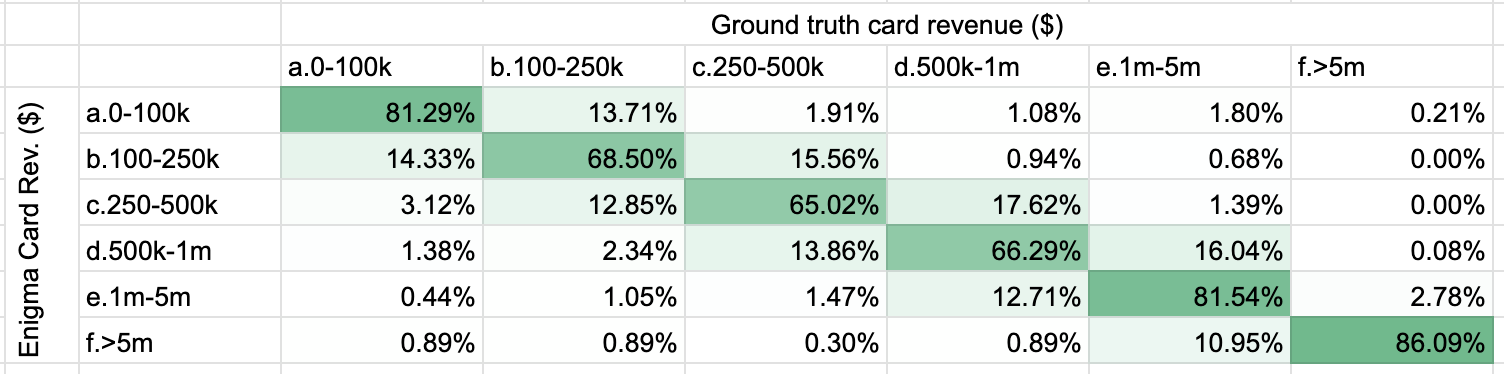
Here is the distribution of Enigma card revenue bucket ($) vs. ground truth card revenue bucket ($), confirming that most false positives are in adjacent buckets. % calculated on rows.
Troubleshooting Data Quality Issues
When comparing Enigma's card revenue data to your ground truth data, you may encounter two common challenges. Here's how to identify and address them:
Challenge 1: Entity Matching Quality
Poor entity matching is the most frequent cause of significant revenue discrepancies. Always validate your matches before comparing revenue data.
Problem Signs
- Multiple input rows matching to the same Enigma ID
- Extreme revenue discrepancies (e.g., small local business matching to a major corporation)
- Low match confidence scores
Example of Poor Matching
{
  "input": {
    "name": "Ray's Cycles - Cedarhurst",
    "website": "www.facebook.com/profile/98746585",
    "address": "NY"
  },
  "result": "Matched to Facebook, Inc."
}
Best Practices
-
Provide accurate business identifiers:
- Use primary business website, not social media profiles
- Include complete address information
- Provide business legal name when available
-
Validate matches before comparison:
- Review matches with significant revenue differences
- Check for duplicate matches
- Sort by revenue to identify outliers
Challenge 2: Data Comparability
Enigma provides card-based revenue data, which may represent only a portion of a business's total revenue, particularly in certain industries.
Common Scenarios
- Your data includes non-card revenue (cash, checks, invoices)
- Business operates primarily in B2B or wholesale
- Industry typically has low card payment adoption
Solution Framework
-
Assess industry fit:
- High card adoption: retail, restaurants, personal services
- Mixed adoption: professional services, healthcare
- Low adoption: B2B software, wholesale, manufacturing
-
Adjust comparison approach:
For high card adoption industries:
- Direct comparison is valid
- Expected error rate: ±30%

For mixed adoption industries:
- Consider Enigma data as revenue floor
- Focus on trends rather than absolute values

For low adoption industries:
- Use alternative metrics
- Consider excluding from analysis -
Focus on relevant metrics:
- Growth rates for trend analysis
- Relative market position
- Transaction patterns
For the most accurate comparisons, start with businesses in high card adoption industries like retail and restaurants. This provides a baseline for understanding data quality before expanding to more complex cases.